Every service organisation needs to get the right information to the right people at the right time, to help plan and control operations while minimising costs.
With the right tools and experience, dashboard reporting tools have multiple benefits. And with today’s business intelligence (BI) technologies, creating automated dashboards has never been easier.
What is Data Visualisation?
“In any data-driven business, data visualization is necessary. It turns data into visuals, making it easier to understand, digest and make important business decisions from. Data visualization creates actionable insights your team might not have found otherwise.
These tools should be versatile, easy to use and allow you to visualize data in a variety of ways to suit your business’s needs.”
Forbes
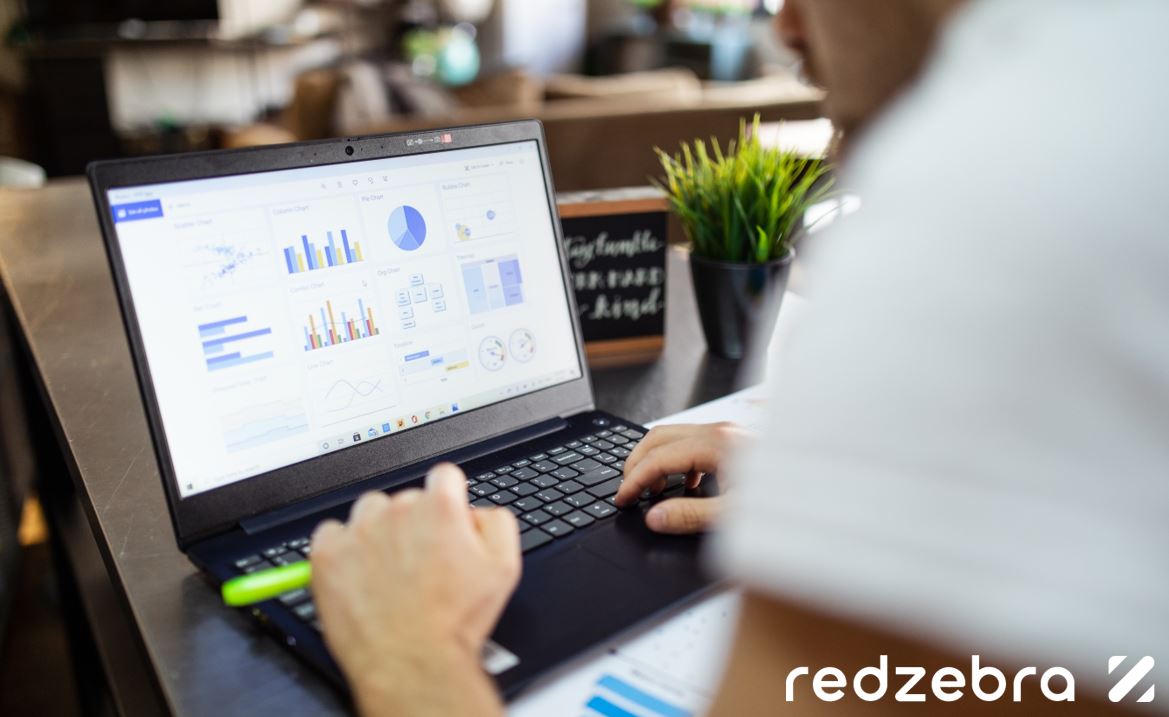
Datasets may appear like a foreign language that nobody outside of the analytics team can understand, but with a Data Visualisation tool you’ll be able to turn the relevant information into something easy to digest. With RedZebra you can create something visually engaging to represent information within a dataset.
Whilst there are many ways to visualise data, RedZebra’s commonly used techniques include:
- Pie charts
- Bar charts
- Lists
- “Summaries”
What is a Dashboard?
A dashboard will organise and present real-time information from multiple sources within your company, in one location. The at-a-glance view will show information relevant to each user and their role, but it will also provide an overview for the management teams to monitor the whole team.
Business Dashboards are valuable BI tools, enabling quick yet informed business decisions. They track Key Performance Indicators (KPIs) and other business metrics.
You can get real-time reporting and instant summaries with RedZebra’s Dashboard module. Providing actionable insights, with improved communication and visual reports. The Live Dashboard can be personalised per-user or shared with the team on a screen in the office, it offers a high level of customisation and visualisation elements.
What are the benefits of a having a real-time dashboard?
- Effortlessly track and monitor KPIs
- Ability to detect problems quickly
- Boost business performance
- Easily share the important information, in real-time
- Automatic collection, analysis and representation of data
- Improved communication
- Enhanced awareness
What is the difference between dashboard and data visualisation?
It’s a combination when you’re using RedZebra’s Dashboard module – A Dashboard provides a snapshot or summary of a large piece of information, making it easier to understand related sets of data. Data Visualisation tools present a visual such as a graph, chart or table, to assist in understanding data quickly and easily.
What is the benefit of real-time data and dashboard software?
Data is a powerful tool. It gives your business the power to spot trends, make decisions, analyse and set reachable goals. But it’s useless without dashboard software in place to help you to understand, support or leverage it.
Take a look at what LinkedIn put together in regards to real-time data:
“Benefits of real-time data. Real-time data can help you achieve several goals in your dashboard, such as enhancing situational awareness and responsiveness, improving efficiency and productivity, increasing customer satisfaction and loyalty, and driving innovation and growth.
Challenges of real-time data. Design your dashboard in a way that makes your real-time data clear, meaningful, and actionable. The right metrics, indicators, and formats should be chosen to display the data in order to prevent confusion or misinterpretation. Additionally, you must protect the data from unauthorized access and comply with relevant laws regarding data collection, storage, and usage.”
LinkedIn
What is the difference between dashboard and reports?
RedZebra’s dashboard is a completely configurable data visualisation tool, providing real-time information. Whereas reports are run periodically and provide detailed static information.
So although they are both use to share and present information within a business, in order to help make informed and important decisions, reports cannot be changed in real-time.
Why are dashboards important?
Most importantly, to provide clarity. Dashboard software tracks, gathers and displays business data in customisable visualisations. It prevents data from being misinterpreted, enables users to monitor data, analyse information and provide actionable insights.
Why Choose RedZebra?
RedZebra comes with all the features you’d expect from a widely-used and popular field service software app. Their Live Dashboard module provides high levels of customisation and real-time data, so you can dive in and get the answers you need to make informed, beneficial business decisions.
If you’d like to explore the potential in more detail, you can email us at [email protected] or call 01296 350350.


